
As a result, there is fear.
We really don’t think we will see the US revisit this less-than-golden time. We have learned from history how to avoid this environment best and hope our leaders will do enough to avoid this economic condition.
But, on second thought…
Roberta Flacks, “Killing Me Softly with His Song” was the #1 song in 1973 for five weeks, longer than any other song that year.
What single has remained in the top 10 the longest in the past year? That would be a song by The Kid Laroi and Justin Bieber called “Stay” which features the following lyric:
“And I’m afraid that I’ma ‘mess’ it up”
Let’s hope instead of strumming my pain, our decision-makers don’t ‘mess’ it up this time.
We do see some policies and decisions that echo those of yesteryear.
From 1973-1982, inflation was extremely high, and the economy experienced two long periods of economic contraction. Contrary to Keynesian Macroeconomic theory, which suggested that inflation and recession were mutually exclusive events. This period saw stagnation in the economy while simultaneously suffering high inflation.
But, why?
There are numerous contributing factors to the stagnation and inflation during that era.
In this article, I will explore a few contributing factors to the economic conditions of the 1970s and early 1980s while also exploring how the current policy decisions are starting to have the feel of the early 1970s. And what, if anything, we have learned from history will help us avoid a return to this economic condition.
Cause #1 1970s Investing in Stagflation: Supply Shock

OPEC refused to sell oil to the United States in October of 1973. This caused shortages coupled with enormous increases in price. This embargo was a direct result of the US support of Israel during the Yom Kippur War.
As we have seen today, skyrocketing oil prices act as a “global tariff”. When energy prices rise, the cost of transporting everything rises as well. In 1972, the price of a barrel of oil averaged $3.22. The inflation rate that year was a manageable 3.21%. By 1974, the price of a barrel of oil was $12.52 (nearly 4 times the price just 2 years earlier). And inflation ballooned and was in excess of 11%.
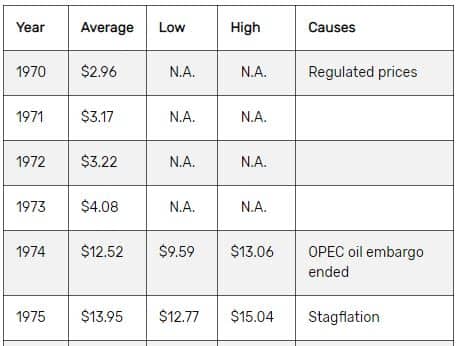
Obviously, the two were intertwined. As oil prices skyrocketed, the cost associated with everything went up accordingly. It cost more to drive, more to ship food, more to grow food, more to go anywhere, and more to do just about anything.
Similar to the OPEC oil embargo of 1973; Russia announced that, as of September 5, 2022, they will no longer supply natural gas to Europe until the economic sanctions that were imposed (due to its invasion of Ukraine) are lifted.
This new “supply shock” has dire consequences for Europe as Winter approaches and, at least, echoes the conditions in 1973.
Cause #2 of 1970s Style Investing During Stagflation: Government Policies
In 1973, Mr. “I’m not a crook” himself, Richard Nixon, was president. And in response to the Oil Embargo, he signed The Emergency Petroleum Allocation Act. This Act authorized federal controls over the price, production, and marketing of oil and gas.
Rather than letting the “free hand” of the market determine price, the government wanted to force a ceiling on the price of oil furthering an era of investing in stagflation.
Guess what?
Doing this did nothing to incentivize domestic production of oil and led to further shortages in supply. Government inaction may have been preferred. Did we learn anything?
Maybe not!
In March of 2022, Joe Biden initiated a ban on Russian imports of oil to “cripple Putin’s war machine”. We fully understand and appreciate the desire to punish Russia for this invasion, but this action certainly creates a disruption in supply. In 2021, the United States imported about 672,000 barrels of oil a day from Russia. So, we are either going to consume less or get the supply from somewhere or a combination of both.
One thing that could be done is to ramp up domestic production.
But the current administration seems to be doing everything in its power to curtail domestic production through its rhetoric and its policies.
Here is a quick summary of the rhetoric and policy decisions by our current administration:
In January of 2021, Biden revoked approval for the Keystone XL Pipeline.
Then in February of 2021, Biden increased the estimates on the cost by more than 7-fold over the estimates of the Trump administration to $51 per ton of carbon dioxide emissions.
In June of 2021, Biden proposed eliminating an enormous amount of tax breaks and incentives enjoyed by the oil and gas industry.
Starting in August of 2021, Joe Biden called on OPEC to increase the production of oil rather than domestic producers. This trend continues to this day having nearly begged for OPEC to ramp up production while simultaneously doing little to encourage the world’s third largest producer of oil, the United States, to do so.
In the third week of October 2021, Joe Biden proposed a new “tax” on natural gas producers. This “methane fee” would be $900 per ton in 2023 and increase to $1500 in 2025.
Evidently, that wasn’t enough of an attack on oil & gas…
Next, on November 17, 2021, Biden asked the FTC to launch an investigation into the high gasoline prices at the retail level. This absolutely ignores the fact that the free market determines the prices we pay at the pump, and the margin at the retail level is extremely low. One wonders if Joe Biden has any understanding of the notion of free markets.
This year, in March of 2022, Joe Biden and congressional democrats proposed a “windfall profits” tax of 50% to punish oil and gas companies for “profiteering” in a climate of high gas prices.
In our estimation, all of this rhetoric is patently negative for the oil & gas industry. This does not foster an environment for domestic producers to make large capital investments with the intent to ramp up production.
Quite the contrary!
These policies, just like in 1973, work to create an aura of hostility with domestic producers and further stoke inflationary pressures due to a lower than potential supply.
Cause #3 of the Last Stagflation: Increase in Money Supply
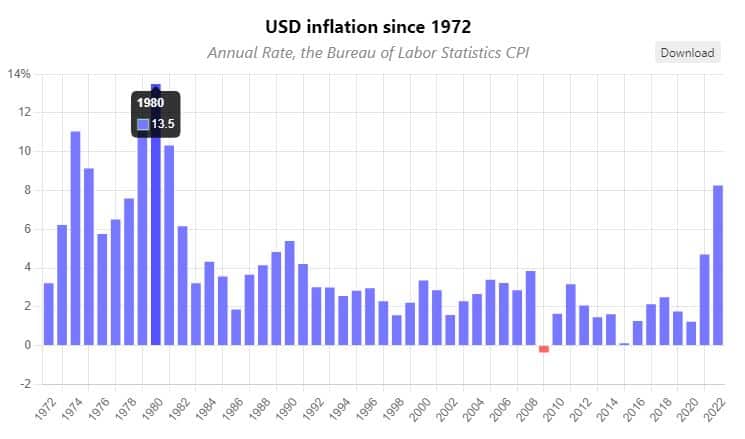
In the early 1970s, the money supply increased at an average rate of around 15% per year. It took a couple of years for this increase in supply to spread throughout the economy and “wreck” the dollar.
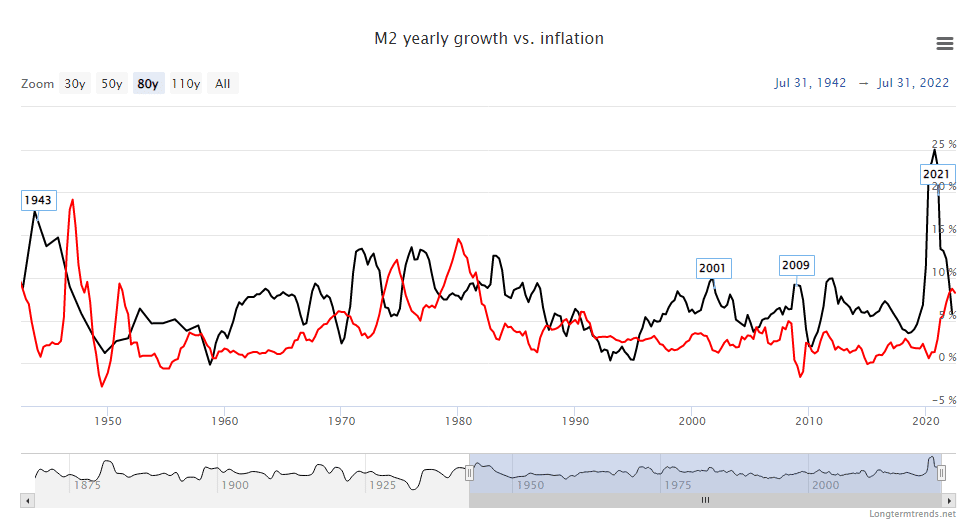
Looking at the graph above, you can see that throughout history inflation (as identified by the red line) lags but definitely has a positive correlation with the increase in the money supply (as identified by the black line).
In 1971, the money supply increased by about 15%. The same thing happened in 1972. In 1973, the M2 supply only increased by slightly more than 5%, but the effects from the prior years were filtering through the economy and inflation soared.
What was the response?
More dovishness!
And the money supply was increased by nearly 15% again for the next couple of years as inflation seemed to be slightly under control in 1976 having fallen to 5%. But what happened a couple of years later as a result of the new increase in M2 having filtered throughout the economy?
Not surprisingly, the rate of inflation spiked to nearly 15% yet again as seen and felt in 1980.
Look what happened to the money supply in 2020 and 2021…
An increase of 25%, and now what are we seeing? Inflation is spiking and lagging!
The good news is that now, unlike in 1973, the Federal Reserve has the historical reference and modeling to make better decisions this time and very likely will.
What Policies Could Be Implemented to Prevent Stagflation?

The stagflation era of the 1970s and 1980s began to come to an end the moment Ronald Reagan was elected President of the United States. And the era of Reaganomics began to reshape the US. His policies centered around making extensive cuts in four major areas; together they worked to end the era of stagflation. He wanted to cut:
- The Growth in Government Spending
- Income and Capital Gains Taxes
- Burdensome Regulations on Businesses
- The Expansion of the Money Supply
Although government spending did not actually decrease due to rapid increases in Defense Spending. All of these pro-business and pro-consumer decisions, coupled with large increases in the federal funds rate under then Fed Chair Paul Volcker, worked to get the inflation rate under control and also end the recession.
Quite possibly, the biggest contributing factor was removing the Nixon-era price controls on oil. With those controls in place equilibrium price was not realized, and therefore shortages of oil supply were a constant threat.
His policies let the free market work.
I am not sure that all of the Reagan-era policies would work as well today, but the pro-business and pro-production rhetoric is greatly needed for the domestic production of oil to increase causing a permanent lowering of its equilibrium price. This is needed for us to prevent another “supply shock”.
What if the Policy Decisions Continue as They Have?
What if the current administration continues its attack on the oil and gas industry?
And, what if our representatives continue to increase government spending, while simultaneously increasing the burden on business?
We don’t believe this will happen in the United States this time around; however, it would be possible for leadership to make decisions that would create at least an echo of this situation. If so, we could see another era of investing in a time of stagflation.
If That Happens, Where Should You Invest Your Money in a Time of Stagflation?
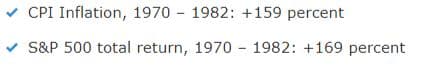
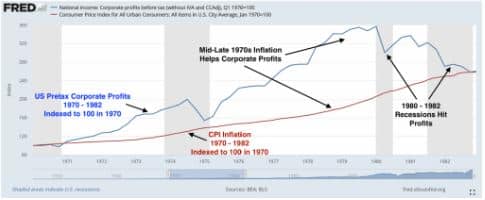
From 1970 to 1982, the total consumer price index rose by a gaudy 159%. Had you liquidated your portfolio in 1970 and left your nest egg invested in cash, every dollar would have ended this economic calamity with the spending power equivalent of 38.6 cents. This means that each dollar would have lost 61.4% of its real value.
Despite the less than stellar total returns of the S&P 500 during this timeframe, each dollar would have ended the period in 1982 worth $2.69 invested in this index. This would have more than kept pace with inflation. The S&P 500 total return exceeded inflation having risen 169% during this timeframe.
Even if our leaders continue to make mistakes, businesses with pricing power should continue to have a very good chance to outpace inflation over the long run as they did during the great stagflation of the 70s and early 80s.
Keep working towards your goals!
And, most importantly, contact us at Dupree Financial Group, LLC to get a set of fresh eyes on your portfolio. Our portfolio Reviews are FREE! Let us help you navigate these turbulent times and give you the confidence to stay the course. You and your money will likely be glad you did.
Dupree Financial Group is a Registered Investment Advisor (RIA) registered with the Securities and Exchange Commission. Registration does not imply a certain level of skill or training. The information presented on this program is for educational purposes only and does not constitute investment advice, a solicitation, or a recommendation to buy or sell any security. Investing involves risk, including the potential loss of principal. Past performance is not indicative of future results. Please consult with a qualified financial advisor before making any investment decisions.
